Market Outlook
September 27, 2016
Market Cues
Domestic Indices
Chg (%)
(Pts)
(Close)
Indian markets are likely to open on a negative note considering global cues.
BSE Sensex
(1.3)
(374)
28,294
Nifty
(1.2)
(109)
8,723
After a notable strength in the previous week, the US stocks moved to the downside
Mid Cap
(0.5)
(71)
13,261
on Monday. The tech-heavy Nasdaq also pulled back further from its earlier closing.
Small Cap
(0.6)
(72)
12,887
The Dow, NASDAQ and S&P 500 all slid 0.9 percent each due to weakness in the
overseas markets as well as profit booking. Trading activity remained somewhat
Bankex
(1.6)
(355)
22,398
subdued, however, with traders looking ahead to tonight's highly anticipated
presidential debate.
Global Indices
Chg (%)
(Pts)
(Close)
The U.K. stocks dropped on Monday, with the week starting off on risk-averse
Dow Jones
(0.9)
(167)
18,095
footing with energy shares under pressure as oil producers gather for industry talks.
Nasdaq
(0.9)
(48)
5,257
The FTSE 100 index fell 1.3% setting negative tone for the week. Oil shares declined
FTSE
(1.3)
(91)
6,818
over oil producers meet in this week. The week’s downbeat start also came in as
Nikkei
(1.3)
(209)
16,545
KPMG survey that showed more than three-quarters of CEOs at U.K. major
Hang Seng
(1.6)
(369)
23,318
corporations are considering moving their headquarters or operations out of Britain
following the U.K’s vote to leave the European Union.
Shanghai Com
(1.8)
(53)
2,980
Indian markets closed on a negative tone yesterday following falling crude oil prices
Advances / Declines
BSE
NSE
and weak economic data from US. Sensex slumped 374 points while Nifty ended
below 8750.
Advances
1,010
524
Declines
1,700
1,100
News Analysis
Unchanged
217
58
Hero enhances focus on premium motorcycle segment
Zee Group may acquire TV 9
Detailed analysis on Pg2
Volumes (` Cr)
BSE
3,435
Investor’s Ready Reckoner
NSE
19,847
Key Domestic & Global Indicators
Stock Watch: Latest investment recommendations on 150+ stocks
Net Inflows (` Cr)
Net
Mtd
Ytd
Refer Pg5 onwards
FII
(248)
4,473
45,141
Top Picks
MFs
327
970
11,079
CMP
Target
Upside
Company
Sector
Rating
(`)
(`)
(%)
Amara Raja Batteries Auto & Auto Ancillary
Buy
1,018
1,174
15.3
Top Gainers
Price (`)
Chg (%)
HCL Tech
IT
Buy
787
1,000
27.0
Marksans
53
10.8
Bharat Electronics
Capital Goods
Accumulate
1,265
1,414
11.8
Raymond
559
4.4
Equitas Holdings
Financials
Buy
178
235
31.8
Gruh
333
3.9
Navkar Corporation Others
Buy
194
265
36.9
Bpcl
621
3.1
More Top Picks on Pg3
Torntpower
190
2.9
Key Upcoming Events
Previous
Consensus
Date
Region
Event Description
Reading
Expectations
Top Losers
Price (`)
Chg (%)
Sep 27 US
Consumer Confidence
101.1
98.8
Prestige
200
(8.1)
Sep 29 US
Initial Jobless claims
252.0
260.0
Ifci
29
(5.6)
Sep 29 China
PMI Manufacturing
50.4
50.4
Supremeind
865
(4.1)
Sep 29 Germany
Unemployment Change (000s)
(7.0)
(5.0)
Ongc
251
(3.8)
Sep 29 Euro Zone
Euro Zone Consumer Confidence
(8.2)
(8.2)
Sep 30 US
GDP QoQ (Annualised)
1.1
1.3
Jublfood
959
(3.5)
Oct 01 UK
GDP YoY
2.2
2.2
6.(
More Events on Pg4
Market Outlook
September 27, 2016
News Analysis
Hero enhances focus on premium motorcycle segment
Hero MotoCorp, is taking steps to widen its presence in the premium segment. It
launched a refreshed variant of its premium motorcycle Achiever 150, priced up to
`62,800 (ex-showroom, Delhi) on Monday. This is the beginning of a wide and
vast effort in the premium segment and company believes that there is a lot more
to come. The company has a stronghold on the domestic 100cc and 125cc
commuter bike segment with a share of 65 and 55 per cent, respectively. But it
aims to expand presence in the 150cc and above segment. Hero's motorcycle
range begins at `40,000 and goes up to `107,000.
Hero's sales in 5MFY17 grew 12 per cent in the first five months of the current year
and has 37 per cent share in the domestic two-wheeler market. The market has
recovered this year due to better sentiments in rural markets on better monsoon
and a push in urban market due to higher wages of government employees. In
July this year, Hero launched its first in-house developed motorcycle, the new
Splendor iSmart 110. Company has said that there is a huge amount of work
going on at its newly inaugurated research and development facility and results
will be seen over next several months.
Zee Group may acquire TV 9
Zee group is likely to buy a majority stake in Hyderabad-based media firm
Associated Broadcasting Company Private Limited (ABCL). ABCL had started with
first 24-hour Telugu news channel under brand name TV9 in the following year
and subsequently expanded to other regional languages. It currently runs 7 news
channels including the TV9 Kannada, TV 9 Marathi and the popular TV 9 Gujarati
news channels.
the deal between the promoters of ABCL and Zee Group was finalised and the
entire transaction was expected to be closed in a couple of months time. Subhash
Chandra-promoted Zee group was one of the four companies that had signed
non-disclosure agreements with the promoters of ABCL some time back. The
details of the proposed transaction, in terms of percentage of equity being
acquired by the Subhash Chandra promoted company, or the deal value was
undisclosed.
Economic and Political News
China slowdown biggest threat to global economy: Ken Rogoff
Government panel clears three new airports in Andhra Pradesh
TRAI to issue notice to warring TELCOS over call failures
Corporate News
Pfizer says not to split into two
GNA Axles closes 18.43% up in stock market debut
SBI merger: Associates to soon submit report to RBI
Market Outlook
September 27, 2016
Top Picks ★★★★★
Large Cap
Market Cap
CMP
Target
Upside
Company
Rationale
(` Cr)
(`)
(`)
(%)
To outpace battery industry growth due to better technological
Amara Raja Batteries
17,391
1,018
1,174
15.3
products leading to market share gains in both the
automotive OEM and replacement segments.
Uptick in defense capex by government when coupled with
Bharat Electronics
30,364
1,265
1,414
11.8
BELs strong market positioning, indicate that good times are
ahead for BEL.
The stock is trading at attractive valuations and is factoring all
HCL Tech
1,11,090
787
1,000
27.0
the bad news.
Back on the growth trend, expect a long term growth of 14%
Infosys
2,37,895
1,036
1,370
32.3
to be a US$20bn in FY2020.
Source: Company, Angel Research
Mid Cap
Market Cap
CMP
Target
Upside
Company
Rationale
(` Cr)
(`)
(`)
(%)
Among the top 4 players in the consumer durables segment.
Bajaj Electricals
2,732
270
306
13.2
Improved profitability backed by turn around in E&P
segment. Strong order book lends earnings visibility.
Favourable outlook for the AC industry to augur well for
Cooling products business which is out pacing the market
Blue Star
5,147
540
578
7.0
growth. EMPPAC division's profitability to improve once
operating environment turns around.
With a focus on the low and medium income (LMI) consumer
Dewan Housing Finance
8,487
291
325
11.7
segment, the company has increased its presence in tier-II &
III cities where the growth opportunity is immense.
Strong loan growth backed by diversified loan portfolio and
adequate CAR. ROE & ROA likely to remain decent as risk of
Equitas Holdings
5,981
178
235
31.8
dilution remains low. Attractive valuations considering
growth.
Expectations of above average monsoon augurs well for
Goodyear India
1,444
626
684
9.3
Goodyear India as it derives ~50% of its turnover from farm
tyre segment.
Economic recovery to have favourable impact on advertising
& circulation revenue growth. Further, the acquisition of a
Jagran Prakashan
6,273
192
225
17.2
radio business (Radio City) would also boost the company's
revenue growth.
Speedier execution and speedier sales, strong revenue
Mahindra Lifespace
1,813
442
522
18.1
visibilty in short-to-long run, attractive valuations
Massive capacity expansion along with rail advantage at ICD
Navkar Corporation
2,761
194
265
36.9
as well CFS augurs well for the company
Earnings boost on back of stable material prices and
Radico Khaitan
1,578
119
125
5.4
favourable pricing environment. Valuation discount to peers
provides additional comfort
Strong brands and distribution network would boost growth
Siyaram Silk Mills
1,233
1,316
1,469
11.7
going ahead. Stock currently trades at an inexpensive
valuation.
Market leadership in Hindi news genre and no. 2 viewership
ranking in English news genre, exit from the radio business,
TV Today Network
1,822
306
363
18.8
and anticipated growth in ad spends by corporates to benefit
the stock.
Source: Company, Angel Research
Market Outlook
September 27, 2016
Key Upcoming Events
Global economic events release calendar
Date
Time
Country
Event Description
Unit
Period
Bloomberg Data
Last Reported Estimated
Sep 27, 2016
7:30PM
US
Consumer Confidence
S.A./ 1985=100
Sep
101.10
98.80
Sep 29, 2016
2:30PM
Euro Zone
Euro-Zone Consumer Confidence
Value
Sep F
(8.20)
(8.20)
6:00PM
US
Initial Jobless claims
Thousands
Sep 24
252.00
260.00
1:25PM
Germany
Unemployment change (000's)
Thousands
Sep
(7.00)
(5.00)
6:30AM
China
PMI Manufacturing
Value
Sep
50.40
50.40
Sep 30, 2016
6:00PM
US
GDP Qoq (Annualised)
% Change
2Q T
1.10
1.30
Oct 1, 2016
2:00PM
UK
GDP (YoY)
% Change
2Q F
2.20
2.20
Oct 3, 2016
1:25PM
Germany
PMI Manufacturing
Value
Sep F
54.30
--
2:00PM
UK
PMI Manufacturing
Value
Sep
53.30
--
Oct 4, 2016
11:00AM
India
RBI Reverse Repo rate
%
Oct 4
6.00
--
11:00AM
India
RBI Repo rate
%
Oct 4
6.50
--
11:00AM
India
RBI Cash Reserve ratio
%
Oct 4
4.00
--
Oct 5, 2016
1:25PM
Germany
PMI Services
Value
Sep F
50.60
--
Oct 7, 2016
2:00PM
UK
Industrial Production (YoY)
% Change
Aug
2.10
--
6:00PM
US
Change in Nonfarm payrolls
Thousands
Sep
151.00
178.00
6:00PM
US
Unnemployment rate
%
Sep
4.90
4.90
Oct 10, 2016
India
Exports YoY%
% Change
Sep
(0.30)
--
India
Imports YoY%
% Change
Sep
(14.09)
--
Oct 12, 2016
5:30PM
India
Industrial Production YoY
% Change
Aug
(2.40)
--
Oct 13, 2016
China
Exports YoY%
% Change
Sep
(2.80)
--
Oct 14, 2016
US
Producer Price Index (mom)
% Change
Sep
(0.30)
--
12:00PM
India
Monthly Wholesale Prices YoY%
% Change
Sep
3.74
--
7:00AM
China
Consumer Price Index (YoY)
% Change
Sep
1.30
--
Oct 17, 2016
2:30PM
Euro Zone
Euro-Zone CPI (YoY)
%
Sep F
0.20
--
6:45PM
US
Industrial Production
%
Sep
(0.43)
--
Oct 18, 2016
6:00PM
US
Consumer price index (mom)
% Change
Sep
0.20
--
6:00PM
US
Housing Starts
Thousands
Sep
1,142.00
--
Source: Bloomberg, Angel Research
Market Outlook
September 27, 2016
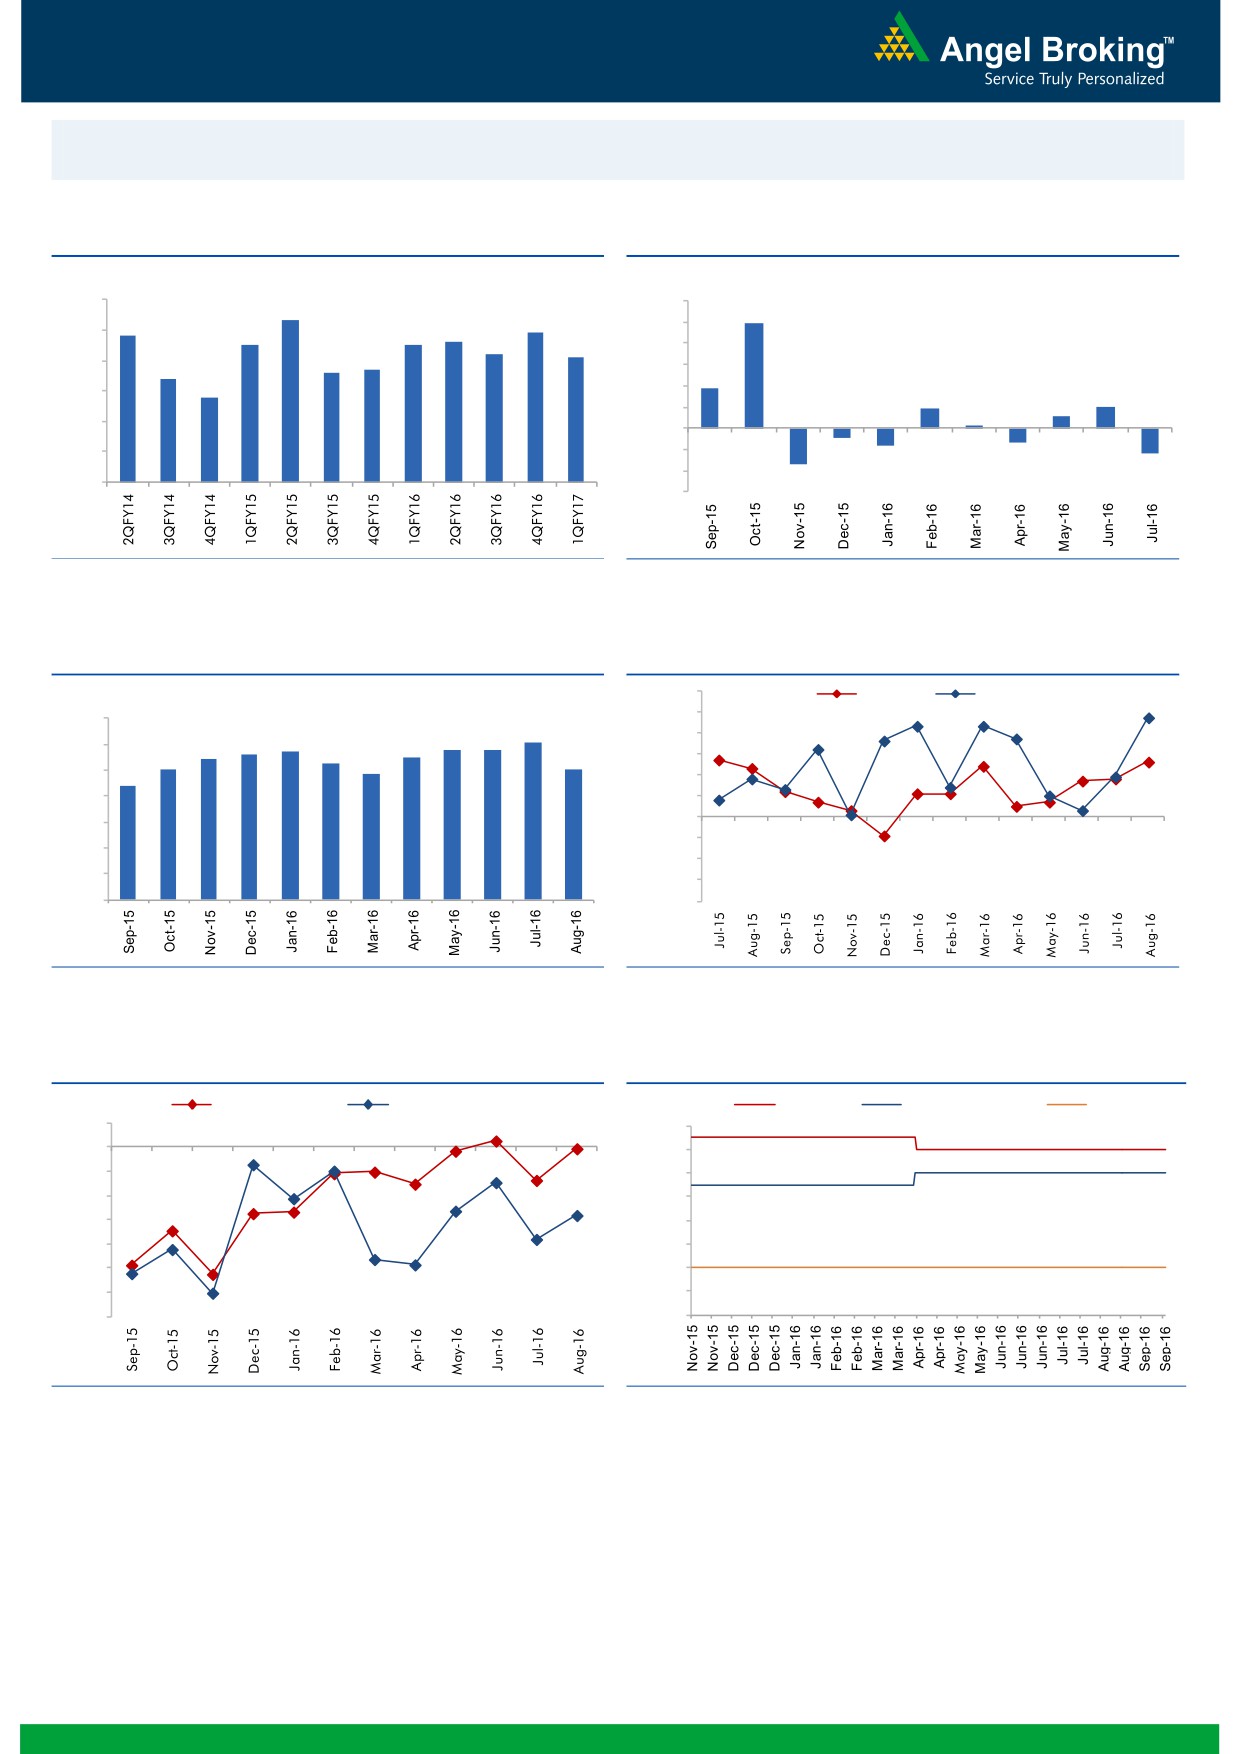
Macro watch
Exhibit 1: Quarterly GDP trends
Exhibit 2: IIP trends
(%)
(%)
9.0
12.0
8.3
9.9
7.8
7.9
8.0
7.5
7.5
7.6
10.0
7.2
7.1
8.0
6.6
6.7
7.0
6.4
6.0
3.7
5.8
6.0
4.0
1.9
2.0
1.1
2.0
0.3
5.0
-
4.0
(2.0)
(0.9)
(1.3)
(1.6)
(4.0)
(2.4)
3.0
(3.4)
(6.0)
Source: CSO, Angel Research
Source: MOSPI, Angel Research
Exhibit 3: Monthly CPI inflation trends
Exhibit 4: Manufacturing and services PMI
56.0
Mfg. PMI
Services PMI
(%)
55.0
7.0
6.1
5.7
5.8
5.8
54.0
6.0
5.4
5.6
5.5
5.0
5.3
5.1
53.0
4.8
5.0
4.4
52.0
4.0
51.0
50.0
3.0
49.0
2.0
48.0
1.0
47.0
-
46.0
Source: MOSPI, Angel Research
Source: Market, Angel Research; Note: Level above 50 indicates expansion
Exhibit 5: Exports and imports growth trends
Exhibit 6: Key policy rates
(%)
Exports yoy growth
Imports yoy growth
(%)
Repo rate
Reverse Repo rate
CRR
5.0
7.00
0.0
6.50
(5.0)
6.00
(10.0)
5.50
(15.0)
5.00
(20.0)
4.50
(25.0)
4.00
(30.0)
3.50
(35.0)
3.00
Source: Bloomberg, Angel Research
Source: RBI, Angel Research
Market Outlook
September 27, 2016
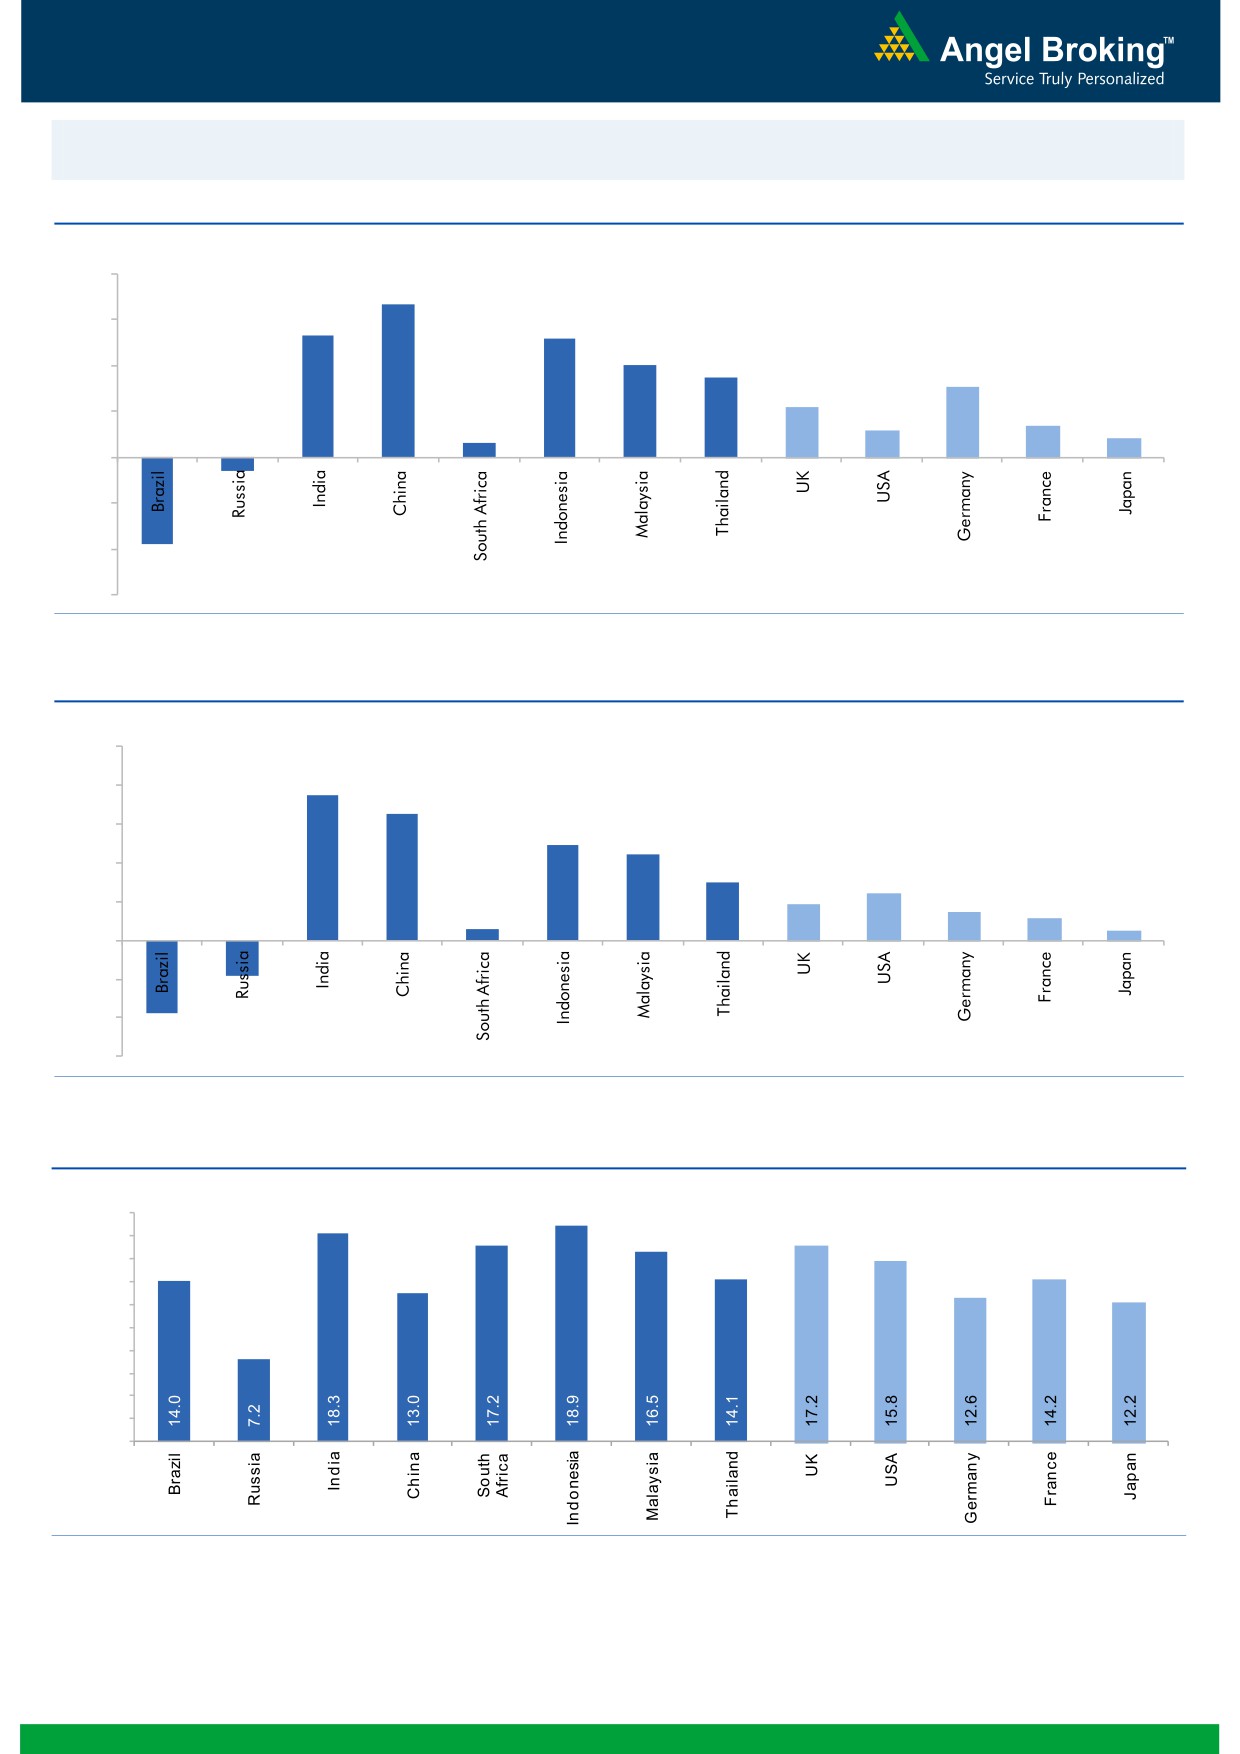
Global watch
Exhibit 1: Latest quarterly GDP Growth (%, yoy) across select developing and developed countries
(%)
8.0
6.7
6.0
5.3
0.6
5.2
4.0
3.5
4.0
3.1
2.2
1.4
2.0
1.2
0.8
-
(2.0)
(0.6)
(4.0)
(3.8)
(6.0)
Source: Bloomberg, Angel Research
Exhibit 2: 2016 GDP Growth projection by IMF (%, yoy) across select developing and developed countries
(%)
10.0
7.5
8.0
6.5
6.0
4.9
4.4
4.0
3.0
2.4
1.9
1.5
2.0
1.1
0.6
0.5
(3.8)
(1.8)
-
(2.0)
(4.0)
(6.0)
Source: IMF, Angel Research
Exhibit 3: One year forward P-E ratio across select developing and developed countries
(x)
20.0
18.0
16.0
14.0
12.0
10.0
8.0
6.0
4.0
2.0
-
Source: IMF, Angel Research
Market Outlook
September 27, 2016
Exhibit 4: Relative performance of indices across globe
Returns (%)
Country
Name of index
Closing price
1M
3M
1YR
Brazil
Bovespa
58,054
0.6
17.9
24.6
Russia
Micex
1,998
0.6
7.6
23.2
India
Nifty
8,723
1.0
6.3
11.4
China
Shanghai Composite
2,980
(3.3)
3.1
(3.3)
South Africa
Top 40
44,964
(3.8)
(1.3)
(0.2)
Mexico
Mexbol
47,253
(1.0)
6.7
12.8
Indonesia
LQ45
925
(2.9)
10.1
24.7
Malaysia
KLCI
1,670
(1.3)
2.2
1.4
Thailand
SET 50
949
(3.5)
5.2
6.6
USA
Dow Jones
18,095
(2.1)
4.0
13.1
UK
FTSE
6,818
(0.3)
14.0
15.4
Japan
Nikkei
16,545
0.3
3.0
(9.4)
Germany
DAX
10,394
(1.3)
10.0
7.6
France
CAC
4,408
0.0
7.8
(4.5)
Source: Bloomberg, Angel Research
Stock Watch
September 27, 2016
Company Name
Reco
CMP
Target
Mkt Cap
Sales ( Čcr )
OPM(%)
EPS (Č)
PER(x)
P/BV(x)
RoE(%)
EV/Sales(x)
(Č)
Price ( Č)
( Č cr )
FY17E FY18E
FY17E
FY18E
FY17E
FY18E
FY17E
FY18E
FY17E
FY18E
FY17E
FY18E
FY17E
FY18E
Agri / Agri Chemical
Rallis
Neutral
222
-
4,309
1,937
2,164
13.3
14.3
9.0
11.0
24.6
20.2
4.3
3.7
18.4
19.8
2.3
2.0
United Phosphorus
Neutral
682
-
34,584
15,176
17,604
18.5
18.5
37.4
44.6
18.2
15.3
3.6
3.0
21.4
21.2
2.4
2.0
Auto & Auto Ancillary
Ashok Leyland
Buy
82
111
23,265
22,407
26,022
10.6
10.6
5.2
6.4
15.7
12.7
3.5
3.0
23.6
24.7
1.1
0.9
Bajaj Auto
Neutral
2,891
-
83,649
25,093
27,891
19.5
19.2
143.9
162.5
20.1
17.8
5.6
4.8
30.3
29.4
3.1
2.7
Bharat Forge
Neutral
938
-
21,840
7,726
8,713
20.5
21.2
35.3
42.7
26.6
22.0
4.9
4.4
18.9
20.1
2.9
2.5
Eicher Motors
Neutral
24,640
-
66,925
16,583
20,447
17.5
18.0
598.0
745.2
41.2
33.1
14.1
10.7
41.2
38.3
3.9
3.1
Gabriel India
Neutral
120
-
1,721
1,544
1,715
9.0
9.3
5.4
6.3
22.2
19.0
4.2
3.7
18.9
19.5
1.1
0.9
Hero Motocorp
Neutral
3,464
-
69,166
31,253
35,198
15.3
15.0
172.3
192.1
20.1
18.0
7.4
6.3
38.9
37.0
2.1
1.8
Jamna Auto Industries Neutral
220
-
1,760
1,486
1,620
9.8
9.9
15.0
17.2
14.7
12.8
3.2
2.7
21.8
21.3
1.3
1.1
L G Balakrishnan & Bros Neutral
583
-
915
1,302
1,432
11.6
11.9
43.7
53.0
13.4
11.0
1.9
1.7
13.8
14.2
0.8
0.7
Mahindra and Mahindra Neutral
1,380
-
85,701
46,534
53,077
11.6
11.7
67.3
78.1
20.5
17.7
3.3
2.9
15.4
15.8
1.8
1.6
Maruti
Neutral
5,567
-
168,153
69,186
82,217
14.7
14.4
198.5
241.4
28.0
23.1
5.5
4.4
20.2
20.0
2.1
1.7
Minda Industries
Neutral
294
-
2,334
2,728
3,042
9.0
9.1
68.2
86.2
4.3
3.4
1.0
0.8
23.8
24.3
0.9
0.8
Motherson Sumi
Neutral
316
-
44,305
45,896
53,687
7.8
8.3
13.0
16.1
24.2
19.6
7.8
6.2
34.7
35.4
1.0
0.9
Rane Brake Lining
Neutral
1,248
-
988
511
562
11.3
11.5
28.1
30.9
44.4
40.4
6.8
6.2
15.3
15.0
2.1
1.9
Setco Automotive
Neutral
44
-
593
741
837
13.0
13.0
15.2
17.0
2.9
2.6
0.5
0.4
15.8
16.3
1.2
1.1
Tata Motors
Neutral
536
-
154,624
300,209
338,549
8.9
8.4
42.7
54.3
12.6
9.9
2.0
1.7
15.6
17.2
0.6
0.5
TVS Motor
Neutral
347
-
16,505
13,390
15,948
6.9
7.1
12.8
16.5
27.2
21.0
6.8
5.4
26.3
27.2
1.3
1.0
Amara Raja Batteries
Buy
1,018
1,174
17,391
5,429
6,471
17.5
17.6
35.3
43.5
28.8
23.4
6.6
5.4
25.3
24.8
3.1
2.5
Exide Industries
Neutral
192
-
16,320
7,439
8,307
15.0
15.0
8.1
9.3
23.7
20.7
3.3
3.0
14.3
16.7
1.8
1.6
Apollo Tyres
Neutral
217
-
11,025
12,877
14,504
14.3
13.9
21.4
23.0
10.1
9.4
1.6
1.4
16.4
15.2
1.0
0.9
Ceat
Neutral
1,186
-
4,798
7,524
8,624
13.0
12.7
131.1
144.3
9.1
8.2
1.7
1.4
19.8
18.6
0.7
0.6
JK Tyres
Neutral
143
-
3,254
7,455
8,056
15.0
15.0
21.8
24.5
6.6
5.9
1.4
1.1
22.8
21.3
0.6
0.5
Swaraj Engines
Neutral
1,186
-
1,473
660
810
15.2
16.4
54.5
72.8
21.8
16.3
6.8
6.2
31.5
39.2
2.1
1.6
Subros
Neutral
130
-
780
1,488
1,681
11.7
11.9
6.4
7.2
20.3
18.1
2.1
2.0
10.8
11.4
0.8
0.6
Indag Rubber
Neutral
175
-
460
286
326
19.8
16.8
11.7
13.3
15.0
13.2
2.5
2.4
17.8
17.1
1.3
1.1
Capital Goods
ACE
Neutral
44
-
431
709
814
4.1
4.6
1.4
2.1
31.1
20.8
1.3
1.2
4.4
6.0
0.8
0.7
BEML
Buy
919
1,157
3,826
3,451
4,055
6.3
9.2
31.4
57.9
29.3
15.9
1.8
1.6
6.3
10.9
1.2
1.0
Bharat Electronics
Accumulate
1,265
1,414
30,364
8,137
9,169
16.8
17.2
58.7
62.5
21.6
20.2
3.3
3.0
44.6
46.3
2.7
2.4
Stock Watch
September 27, 2016
Company Name
Reco
CMP
Target
Mkt Cap
Sales ( Čcr )
OPM(%)
EPS (Č)
PER(x)
P/BV(x)
RoE(%)
EV/Sales(x)
(Č)
Price ( Č)
( Č cr )
FY17E
FY18E
FY17E
FY18E
FY17E
FY18E
FY17E
FY18E
FY17E
FY18E
FY17E
FY18E
FY17E
FY18E
Capital Goods
Voltas
Accumulate
378
407
12,504
6,511
7,514
7.9
8.7
12.9
16.3
29.3
23.2
5.3
4.6
16.7
18.5
1.7
1.4
BGR Energy
Neutral
115
-
828
16,567
33,848
6.0
5.6
7.8
5.9
14.7
19.4
0.8
0.8
4.7
4.2
0.2
0.1
BHEL
Neutral
143
-
34,964
28,797
34,742
-
2.8
2.3
6.9
62.1
20.7
1.1
1.0
1.3
4.8
0.9
0.6
Blue Star
Accumulate
540
578
5,147
4,351
5,024
6.4
7.1
17.2
20.6
31.4
26.2
20.5
17.0
23.1
24.1
1.2
1.1
Crompton Greaves
Neutral
80
-
5,020
5,777
6,120
5.9
7.0
3.3
4.5
24.3
17.8
1.1
1.0
4.4
5.9
0.8
0.7
Greaves Cotton
Neutral
128
-
3,123
1,755
1,881
16.8
16.9
7.8
8.5
16.4
15.1
3.3
3.1
20.6
20.9
1.5
1.3
Inox Wind
Buy
206
286
4,574
5,605
6,267
15.7
16.4
24.8
30.0
8.3
6.9
2.3
1.7
25.9
24.4
0.9
0.7
KEC International
Neutral
126
-
3,234
9,294
10,186
7.9
8.1
9.9
11.9
12.7
10.6
1.9
1.6
15.6
16.3
0.6
0.5
Thermax
Neutral
849
-
10,113
5,421
5,940
7.3
7.3
25.7
30.2
33.0
28.1
4.0
3.7
12.2
13.1
1.7
1.6
VATech Wabag
Buy
553
681
3,013
3,136
3,845
8.9
9.1
26.0
35.9
21.3
15.4
2.7
2.3
13.4
15.9
0.9
0.7
Cement
ACC
Neutral
1,606
-
30,166
11,225
13,172
13.2
16.9
44.5
75.5
36.1
21.3
3.4
3.2
11.2
14.2
2.7
2.3
Ambuja Cements
Neutral
255
-
50,694
9,350
10,979
18.2
22.5
5.8
9.5
44.0
26.9
3.7
3.3
10.2
12.5
5.4
4.6
India Cements
Neutral
148
-
4,560
4,364
4,997
18.5
19.2
7.9
11.3
18.8
13.1
1.4
1.3
8.0
8.5
1.8
1.6
JK Cement
Neutral
829
-
5,796
4,398
5,173
15.5
17.5
31.2
55.5
26.6
14.9
3.2
2.8
12.0
15.5
1.9
1.5
J K Lakshmi Cement
Neutral
486
-
5,713
2,913
3,412
14.5
19.5
7.5
22.5
64.7
21.6
4.0
3.4
12.5
18.0
2.5
2.1
Orient Cement
Neutral
200
-
4,097
2,114
2,558
18.5
20.5
8.1
11.3
24.7
17.7
3.6
3.1
9.0
14.0
2.6
2.0
UltraTech Cement
Neutral
3,937
-
108,043
25,768
30,385
21.0
23.5
111.0
160.0
35.5
24.6
4.5
4.0
13.5
15.8
4.3
3.6
Construction
ITNL
Neutral
101
-
3,313
8,946
10,017
31.0
31.6
8.1
9.1
12.4
11.1
0.5
0.5
4.2
5.0
3.7
3.4
KNR Constructions
Neutral
764
-
2,149
1,385
1,673
14.7
14.0
41.2
48.5
18.5
15.8
3.5
3.0
14.9
15.2
1.6
1.3
Larsen & Toubro
Buy
1,469
1,700
136,884
67,665
77,249
10.7
11.5
57.3
71.2
25.6
20.6
2.4
2.2
12.6
14.3
2.2
1.9
Gujarat Pipavav Port
Neutral
172
-
8,330
705
788
52.2
51.7
5.0
5.6
34.5
30.8
3.4
3.1
11.2
11.2
11.5
9.8
Nagarjuna Const.
Neutral
85
-
4,728
8,842
9,775
9.1
8.8
5.3
6.4
16.1
13.3
1.3
1.2
8.2
9.1
0.7
0.6
PNC Infratech
Buy
121
143
3,114
2,350
2,904
13.1
13.2
9.0
8.8
13.5
13.8
0.5
0.4
15.9
13.9
1.4
1.2
Simplex Infra
Neutral
336
-
1,663
6,829
7,954
10.5
10.5
31.4
37.4
10.7
9.0
1.1
1.0
9.9
13.4
0.7
0.6
Power Mech Projects
Neutral
504
-
742
1,801
2,219
12.7
14.6
72.1
113.9
7.0
4.4
1.3
1.1
16.8
11.9
0.4
0.3
Sadbhav Engineering
Accumulate
283
298
4,850
3,598
4,140
10.3
10.6
9.0
11.9
31.4
23.8
3.3
2.9
9.9
11.9
1.6
1.4
NBCC
Neutral
253
-
15,165
7,428
9,549
7.9
8.6
8.2
11.0
30.8
23.0
1.5
1.2
28.2
28.7
1.8
1.3
MEP Infra
Neutral
44
-
721
1,877
1,943
30.6
29.8
3.0
4.2
14.8
10.6
7.2
4.8
0.6
0.6
1.8
1.6
SIPL
Neutral
109
-
3,832
1,036
1,252
65.5
66.2
(8.4)
(5.6)
4.1
4.7
(22.8)
(15.9)
11.9
9.9
Stock Watch
September 27, 2016
Company Name
Reco
CMP
Target
Mkt Cap
Sales ( Čcr )
OPM(%)
EPS (Č)
PER(x)
P/BV(x)
RoE(%)
EV/Sales(x)
(Č)
Price ( Č)
( Č cr )
FY17E
FY18E
FY17E
FY18E
FY17E
FY18E
FY17E
FY18E
FY17E
FY18E
FY17E
FY18E
FY17E
FY18E
Construction
Engineers India
Neutral
255
-
8,602
1,725
1,935
16.0
19.1
11.4
13.9
22.4
18.4
3.1
3.0
13.4
15.3
3.9
3.5
Financials
Axis Bank
Neutral
548
-
130,699
58,081
66,459
3.5
3.5
32.4
44.6
16.9
12.3
2.2
1.9
13.6
16.5
-
-
Bank of Baroda
Neutral
167
-
38,376
19,980
23,178
1.8
1.8
11.5
17.3
14.5
9.6
1.7
1.4
8.3
10.1
-
-
Canara Bank
Neutral
304
-
16,523
15,225
16,836
1.8
1.8
14.5
28.0
21.0
10.9
1.5
1.2
5.8
8.5
-
-
Dewan Housing Finance Accumulate
291
325
8,487
2,225
2,688
2.9
2.9
29.7
34.6
9.8
8.4
1.6
1.4
16.1
16.8
-
-
Equitas Holdings
Buy
178
235
5,981
939
1,281
11.7
11.5
5.8
8.2
30.8
21.8
2.7
2.4
10.9
11.5
-
-
Federal Bank
Neutral
73
-
12,526
9,353
10,623
2.9
2.9
4.4
5.8
16.6
12.6
1.6
1.4
9.5
11.0
-
-
HDFC
Neutral
1,414
-
223,509
11,475
13,450
3.4
3.4
45.3
52.5
31.2
26.9
6.0
5.3
20.2
20.5
-
-
HDFC Bank
Neutral
1,297
-
328,329
46,097
55,433
4.5
4.5
58.4
68.0
22.2
19.1
3.9
3.3
18.8
18.6
-
-
ICICI Bank
Neutral
263
-
153,101
39,029
45,903
3.3
3.3
16.7
16.3
15.8
16.2
2.0
1.8
10.1
12.4
-
-
LIC Housing Finance
Neutral
568
-
28,675
3,712
4,293
2.6
2.5
39.0
46.0
14.6
12.4
2.7
2.3
19.9
20.1
-
-
Punjab Natl.Bank
Neutral
140
-
29,802
23,532
23,595
2.3
2.4
6.8
12.6
20.6
11.1
3.2
2.3
3.3
6.5
-
-
RBL Bank
Accumulate
302
325
11,176
1,783
2,309
2.6
2.6
12.7
16.4
23.8
18.4
2.6
2.3
12.8
13.3
-
-
South Ind.Bank
Neutral
22
-
3,031
6,435
7,578
2.5
2.5
2.7
3.1
8.3
7.2
1.1
0.9
10.1
11.2
-
-
St Bk of India
Neutral
252
-
195,350
88,650
98,335
2.6
2.6
13.5
18.8
18.6
13.4
1.8
1.6
7.0
8.5
-
-
Union Bank
Neutral
141
-
9,714
13,450
14,925
2.3
2.3
25.5
34.5
5.5
4.1
0.8
0.7
7.5
10.2
-
-
Yes Bank
Neutral
1,236
-
52,035
8,978
11,281
3.3
3.4
74.0
90.0
16.7
13.7
3.2
2.7
17.0
17.2
-
-
FMCG
Asian Paints
Neutral
1,180
-
113,224
17,128
18,978
16.8
16.4
19.1
20.7
61.8
57.0
21.5
20.3
34.8
35.5
6.5
5.9
Britannia
Neutral
3,417
-
40,992
9,795
11,040
14.6
14.9
80.3
94.0
42.6
36.4
17.5
13.5
41.2
-
4.1
3.5
Colgate
Neutral
974
-
26,485
4,605
5,149
23.4
23.4
23.8
26.9
40.9
36.2
22.7
17.7
64.8
66.8
5.7
5.1
Dabur India
Neutral
281
-
49,485
8,315
9,405
19.8
20.7
8.1
9.2
34.7
30.6
9.7
8.0
31.6
31.0
5.6
4.9
GlaxoSmith Con*
Neutral
6,110
-
25,698
4,350
4,823
21.2
21.4
179.2
196.5
34.1
31.1
9.1
7.7
27.1
26.8
5.3
4.7
Godrej Consumer
Neutral
1,601
-
54,508
10,235
11,428
18.4
18.6
41.1
44.2
39.0
36.2
8.6
7.3
24.9
24.8
5.4
4.8
HUL
Neutral
893
-
193,191
35,252
38,495
17.6
17.4
20.4
21.9
43.7
40.8
35.9
31.5
82.2
77.3
5.3
4.8
ITC
Accumulate
248
283
299,598
40,059
44,439
39.0
39.2
9.1
10.1
27.3
24.6
7.4
6.5
27.2
26.5
7.0
6.3
Marico
Neutral
279
-
36,054
6,430
7,349
18.8
19.5
6.4
7.7
43.7
36.3
13.2
11.1
33.2
32.5
5.4
4.7
Nestle*
Neutral
6,505
-
62,720
10,073
11,807
20.7
21.5
124.8
154.2
52.1
42.2
21.4
19.3
34.8
36.7
6.0
5.1
Tata Global
Neutral
141
-
8,877
8,675
9,088
9.8
9.8
7.4
8.2
19.0
17.2
2.2
2.1
7.9
8.1
0.9
0.9
Procter & Gamble
Accumulate
6,870
7,369
22,301
2,939
3,342
23.2
23.0
146.2
163.7
47.0
42.0
105.2
100.9
25.3
23.5
7.1
6.2
Hygiene
Stock Watch
September 27, 2016
Company Name
Reco
CMP
Target
Mkt Cap
Sales ( Čcr )
OPM(%)
EPS (Č)
PER(x)
P/BV(x)
RoE(%)
EV/Sales(x)
(Č)
Price ( Č)
( Č cr )
FY17E FY18E
FY17E
FY18E
FY17E
FY18E
FY17E
FY18E
FY17E
FY18E
FY17E
FY18E
FY17E
FY18E
IT
HCL Tech^
Buy
787
1,000
111,090
49,242
57,168
20.5
20.5
55.7
64.1
14.1
12.3
2.9
2.2
20.3
17.9
2.1
1.7
Infosys
Buy
1,036
1,370
237,895
69,934
79,025
27.5
27.5
64.8
72.0
16.0
14.4
3.5
3.2
22.0
22.3
2.9
2.5
TCS
Buy
2,401
3,004
473,070
121,684
136,286
27.3
27.3
135.0
150.1
17.8
16.0
5.9
5.4
33.2
33.9
3.7
3.2
Tech Mahindra
Buy
448
700
43,458
30,347
33,685
17.0
17.0
37.5
41.3
11.9
10.8
2.6
2.3
21.8
20.7
1.2
1.0
Wipro
Buy
479
680
116,383
51,631
55,822
21.7
17.9
35.9
36.9
13.3
13.0
2.8
2.6
19.0
18.1
1.9
1.7
Media
D B Corp
Neutral
399
-
7,327
2,297
2,590
27.4
28.2
21.0
23.4
19.0
17.0
4.4
3.8
23.7
23.1
3.0
2.6
HT Media
Neutral
82
-
1,909
2,693
2,991
12.6
12.9
7.9
9.0
10.4
9.1
0.9
0.8
7.8
8.3
0.3
0.2
Jagran Prakashan
Buy
192
225
6,273
2,355
2,635
28.0
28.0
10.8
12.5
17.8
15.4
3.9
3.3
21.7
21.7
2.7
2.4
Sun TV Network
Neutral
497
-
19,604
2,850
3,265
70.1
71.0
26.2
30.4
19.0
16.4
4.9
4.3
24.3
25.6
6.5
5.5
Hindustan Media
Neutral
283
-
2,080
1,016
1,138
24.3
25.2
27.3
30.1
10.4
9.4
2.0
1.8
16.2
15.8
1.4
1.2
Ventures
TV Today Network
Buy
306
363
1,822
637
743
27.5
27.5
18.4
21.4
16.6
14.3
2.9
2.5
17.4
17.2
2.5
2.0
Metals & Mining
Coal India
Neutral
333
-
210,114
84,638
94,297
21.4
22.3
24.5
27.1
13.6
12.3
5.7
5.4
42.6
46.0
2.0
1.8
Hind. Zinc
Neutral
229
-
96,612
14,252
18,465
55.9
48.3
15.8
21.5
14.5
10.6
2.4
2.1
17.0
20.7
6.8
5.2
Hindalco
Neutral
153
-
31,625
107,899
112,095
7.4
8.2
9.2
13.0
16.7
11.8
0.8
0.8
4.8
6.6
0.8
0.8
JSW Steel
Neutral
1,758
-
42,504
53,201
58,779
16.1
16.2
130.6
153.7
13.5
11.4
1.8
1.6
14.0
14.4
1.6
1.4
NMDC
Neutral
106
-
41,967
6,643
7,284
44.4
47.7
7.1
7.7
14.9
13.8
1.3
1.3
8.8
9.2
4.1
3.7
SAIL
Neutral
48
-
19,804
47,528
53,738
(0.7)
2.1
(1.9)
2.6
18.4
0.5
0.5
(1.6)
3.9
1.3
1.2
Vedanta
Neutral
169
-
49,985
71,744
81,944
19.2
21.7
13.4
20.1
12.6
8.4
1.1
1.0
8.4
11.3
1.1
0.8
Tata Steel
Neutral
370
-
35,974
121,374
121,856
7.2
8.4
18.6
34.3
19.9
10.8
1.2
1.1
6.1
10.1
0.9
0.9
Oil & Gas
Cairn India
Neutral
194
-
36,429
9,127
10,632
4.3
20.6
8.8
11.7
22.1
16.6
0.7
0.7
3.3
4.2
5.5
4.5
GAIL
Neutral
377
-
47,860
56,220
65,198
9.3
10.1
27.1
33.3
13.9
11.3
1.3
1.2
9.3
10.7
1.0
0.9
ONGC
Neutral
251
-
214,315
137,222
152,563
15.0
21.8
19.5
24.1
12.9
10.4
1.1
1.0
8.5
10.1
1.8
1.6
Indian Oil Corp
Neutral
592
-
143,783
373,359
428,656
5.9
5.5
54.0
59.3
11.0
10.0
1.7
1.5
16.0
15.6
0.5
0.5
Reliance Industries
Neutral
1,109
-
359,701
301,963
358,039
12.1
12.6
87.7
101.7
12.7
10.9
1.3
1.2
10.7
11.3
1.7
1.4
Pharmaceuticals
Alembic Pharma
Neutral
685
-
12,907
3,483
4,083
20.2
21.4
24.3
30.4
28.2
22.5
6.4
5.1
25.5
25.3
3.6
3.0
Aurobindo Pharma
Neutral
838
-
49,026
15,720
18,078
23.7
23.7
41.4
47.3
20.2
17.7
5.3
4.1
29.6
26.1
3.3
2.9
Sanofi India*
Neutral
4,257
-
9,804
2,357
2,692
17.3
17.3
153.5
169.2
27.7
25.2
4.7
3.8
25.8
28.4
3.8
3.1
Cadila Healthcare
Neutral
393
-
40,248
11,126
13,148
22.0
22.0
17.1
20.0
23.0
19.7
5.9
4.7
28.8
26.6
3.6
3.0
Cipla
Sell
604
490
48,552
15,378
18,089
17.4
18.4
21.6
27.2
28.0
22.2
3.6
3.2
13.7
15.2
3.4
2.8
Stock Watch
September 27, 2016
Company Name
Reco
CMP
Target
Mkt Cap
Sales ( Čcr )
OPM(%)
EPS (Č)
PER(x)
P/BV(x)
RoE(%)
EV/Sales(x)
(Č)
Price ( Č)
( Č cr )
FY17E FY18E
FY17E
FY18E
FY17E
FY18E
FY17E
FY18E
FY17E
FY18E
FY17E
FY18E
FY17E
FY18E
Pharmaceuticals
Dr Reddy's
Neutral
3,191
-
52,882
16,043
18,119
23.1
24.7
126.0
157.8
25.3
20.2
3.7
3.2
15.7
17.1
3.3
2.9
Dishman Pharma
Sell
215
45
3,475
1,718
1,890
22.7
22.8
9.5
11.3
22.7
19.1
2.2
2.0
10.1
10.9
2.5
2.2
GSK Pharma*
Neutral
2,797
-
23,692
3,528
3,811
16.6
18.8
51.8
59.4
54.0
47.1
14.5
14.4
26.3
30.6
6.5
6.1
Indoco Remedies
Sell
343
225
3,164
1,112
1,289
18.2
18.2
13.2
15.6
26.0
22.0
4.6
3.9
19.2
19.2
3.0
2.6
Ipca labs
Neutral
593
-
7,476
3,303
3,799
15.3
15.3
17.3
19.7
34.3
30.1
3.0
2.7
9.1
9.4
2.4
2.1
Lupin
Buy
1,495
1,809
67,403
15,912
18,644
26.4
26.7
58.1
69.3
25.7
21.6
5.0
4.1
21.4
20.9
4.3
3.5
Sun Pharma
Buy
766
944
184,437
31,129
35,258
30.0
30.9
28.0
32.8
27.4
23.4
4.2
3.5
18.7
18.9
5.5
4.7
Power
Tata Power
Neutral
76
-
20,515
36,916
39,557
17.4
27.1
5.1
6.3
14.9
12.0
1.3
1.2
9.0
10.3
1.6
1.4
NTPC
Neutral
152
-
125,537
86,605
95,545
17.5
20.8
11.8
13.4
12.9
11.4
1.3
1.2
10.5
11.1
2.8
2.8
Power Grid
Neutral
175
-
91,657
25,763
29,762
74.3
73.1
14.8
17.3
11.8
10.1
1.9
1.6
16.9
17.5
7.8
7.5
Real Estate
MLIFE
Buy
442
522
1,813
1,152
1,300
22.7
24.6
29.9
35.8
14.8
12.3
1.1
1.0
7.6
8.6
2.3
1.9
Telecom
Bharti Airtel
Neutral
320
-
128,097
105,086
114,808
34.5
34.7
12.2
16.4
26.3
19.5
1.8
1.7
6.8
8.4
2.1
1.9
Idea Cellular
Neutral
81
-
28,986
40,133
43,731
37.2
37.1
6.4
6.5
12.6
12.4
1.1
1.0
8.2
7.6
1.7
1.5
zOthers
Abbott India
Neutral
4,761
-
10,116
3,153
3,583
14.1
14.4
152.2
182.7
31.3
26.1
153.6
131.2
25.6
26.1
2.9
2.5
Bajaj Electricals
Accumulate
270
306
2,732
5,099
5,805
5.6
5.9
11.4
14.6
23.8
18.6
3.2
2.8
13.4
15.1
0.5
0.5
Finolex Cables
Neutral
431
-
6,599
2,883
3,115
12.0
12.1
14.2
18.6
30.4
23.2
16.2
14.1
15.8
14.6
2.0
1.8
Goodyear India*
Accumulate
626
684
1,444
1,598
1,704
10.4
10.2
49.4
52.6
12.7
11.9
58.5
51.3
18.2
17.0
0.6
79.8
Hitachi
Neutral
1,588
-
4,318
2,081
2,433
8.8
8.9
33.4
39.9
47.5
39.8
38.4
32.0
22.1
21.4
2.1
1.7
Jyothy Laboratories
Neutral
344
-
6,226
1,440
2,052
11.5
13.0
8.5
10.0
40.4
34.4
9.8
9.1
18.6
19.3
4.6
3.2
Page Industries
Neutral
14,858
-
16,572
2,450
3,124
20.1
17.6
299.0
310.0
49.7
47.9
330.9
252.6
47.1
87.5
6.8
5.4
Relaxo Footwears
Neutral
458
-
5,492
2,085
2,469
9.2
8.2
7.6
8.0
60.5
57.6
23.5
20.0
17.9
18.8
2.7
2.3
Siyaram Silk Mills
Accumulate
1,316
1,469
1,233
1,799
2,040
11.6
11.7
104.9
122.4
12.5
10.8
2.1
1.8
16.4
16.4
0.9
0.8
Styrolution ABS India*
Neutral
598
-
1,052
1,440
1,537
9.2
9.0
40.6
42.6
14.7
14.0
37.6
34.2
12.3
11.6
0.7
0.6
TVS Srichakra
Neutral
3,016
-
2,309
2,304
2,614
13.7
13.8
231.1
266.6
13.1
11.3
338.9
266.8
33.9
29.3
1.0
0.9
HSIL
Neutral
341
-
2,466
2,384
2,515
15.8
16.3
15.3
19.4
22.3
17.6
22.2
19.1
7.8
9.3
1.2
1.1
Kirloskar Engines India
Neutral
331
-
4,782
2,554
2,800
9.9
10.0
10.5
12.1
31.5
27.3
13.2
12.4
10.7
11.7
1.5
1.3
Ltd
M M Forgings
Neutral
424
-
512
546
608
20.4
20.7
41.3
48.7
10.3
8.7
58.1
51.4
16.6
17.0
0.8
0.7
Banco Products (India)
Neutral
218
-
1,561
1,353
1,471
12.3
12.4
14.5
16.3
15.1
13.4
20.8
18.7
14.5
14.6
1.1
117.5
Competent Automobiles Neutral
195
-
120
1,137
1,256
3.1
2.7
28.0
23.6
7.0
8.3
37.5
33.9
14.3
11.5
0.1
0.1
Stock Watch
September 27, 2016
Company Name
Reco
CMP
Target
Mkt Cap
Sales ( Čcr )
OPM(%)
EPS (Č)
PER(x)
P/BV(x)
RoE(%)
EV/Sales(x)
(Č)
Price ( Č)
( Č cr )
FY17E
FY18E
FY17E
FY18E
FY17E
FY18E
FY17E
FY18E
FY17E
FY18E
FY17E
FY18E
FY17E
FY18E
zOthers
Nilkamal
Neutral
1,331
-
1,986
1,995
2,165
10.7
10.4
69.8
80.6
19.1
16.5
76.1
66.1
16.6
16.5
1.0
0.9
Visaka Industries
Neutral
197
-
313
1,051
1,138
10.3
10.4
21.0
23.1
9.4
8.5
25.3
23.7
9.0
9.2
0.6
0.5
Transport Corporation of
Neutral
194
-
1,484
2,671
2,911
8.5
8.8
13.9
15.7
14.0
12.4
1.9
1.7
13.7
13.8
0.7
0.6
India
Elecon Engineering
Neutral
61
-
662
1,482
1,660
13.7
14.5
3.9
5.8
15.6
10.5
3.7
3.4
7.8
10.9
0.8
0.7
Surya Roshni
Neutral
228
-
998
3,342
3,625
7.8
7.5
17.3
19.8
13.2
11.5
25.0
20.1
10.5
10.8
0.6
0.5
MT Educare
Neutral
131
-
521
366
417
17.7
18.2
9.4
10.8
14.0
12.1
3.1
2.7
22.2
22.3
1.3
1.1
Radico Khaitan
Accumulate
119
125
1,578
1,659
1,802
13.0
13.2
6.3
7.4
18.7
16.1
1.6
1.5
8.6
9.3
1.4
1.3
Garware Wall Ropes
Neutral
519
-
1,137
873
938
12.9
13.1
30.9
34.9
16.8
14.9
2.6
2.3
15.7
15.2
1.2
1.1
Wonderla Holidays
Neutral
387
-
2,187
287
355
38.0
40.0
11.3
14.2
34.3
27.3
4.9
4.3
21.4
23.9
7.3
5.9
Linc Pen & Plastics
Neutral
275
-
407
382
420
9.3
9.5
13.5
15.7
20.4
17.5
3.5
3.0
17.1
17.3
1.1
1.0
The Byke Hospitality
Neutral
161
-
644
287
384
20.5
20.5
7.6
10.7
21.1
15.0
4.4
3.6
20.7
23.5
2.3
1.7
Interglobe Aviation
Neutral
939
-
33,836
21,122
26,005
14.5
27.6
110.7
132.1
8.5
7.1
50.8
36.3
168.5
201.1
1.6
1.2
Coffee Day Enterprises
Neutral
225
-
4,642
2,964
3,260
20.5
21.2
4.7
8.0
-
28.2
2.6
2.4
5.5
8.5
2.0
1.8
Ltd
Navneet Education
Neutral
100
-
2,393
1,062
1,147
24.0
24.0
6.1
6.6
16.5
15.2
3.4
3.0
20.6
19.8
2.3
2.2
Navkar Corporation
Buy
194
265
2,761
408
612
42.9
42.3
6.8
11.5
28.6
16.8
2.0
1.8
6.9
10.5
7.7
5.1
UFO Moviez
Neutral
479
-
1,323
619
685
33.2
33.4
30.0
34.9
16.0
13.7
2.2
1.9
13.8
13.9
1.8
1.5
VRL Logistics
Neutral
297
-
2,705
1,902
2,119
16.7
16.6
14.6
16.8
20.4
17.6
4.5
3.9
21.9
22.2
1.5
1.3
Team Lease Serv.
Neutral
1,095
-
1,872
3,229
4,001
1.5
1.8
22.8
32.8
48.1
33.3
5.2
4.5
10.7
13.4
0.5
0.4
S H Kelkar & Co.
Neutral
314
-
4,537
1,036
1,160
15.1
15.0
6.1
7.2
51.4
43.7
5.5
5.0
10.7
11.5
4.2
3.8
Quick Heal
Neutral
231
-
1,617
408
495
27.3
27.0
7.7
8.8
29.8
26.3
2.8
2.8
9.3
10.6
3.1
2.6
Narayana Hrudaya
Neutral
325
-
6,648
1,873
2,166
11.5
11.7
2.6
4.0
123.0
82.1
7.6
6.8
6.1
8.3
3.6
3.1
Manpasand Bever.
Neutral
730
-
3,655
836
1,087
19.6
19.4
16.9
23.8
43.2
30.7
5.2
4.5
12.0
14.8
4.1
3.1
Parag Milk Foods
Neutral
295
-
2,481
1,919
2,231
9.3
9.6
9.5
12.9
31.2
22.8
4.9
4.0
15.5
17.5
1.4
1.2
Mirza International
Buy
94
113
1,125
1,024
1,148
18.0
18.0
6.9
8.0
13.6
11.7
2.3
1.9
16.6
16.2
1.3
1.1
Source: Company, Angel Research; Note: *December year end; #September year end; &October year end; Price as on September 26, 2016
Market Outlook
September 27, 2016
Research Team Tel: 022 - 39357800
DISCLAIMER
Angel Broking Private Limited (hereinafter referred to as “Angel”) is a registered Member of National Stock Exchange of India
Limited,Bombay Stock Exchange Limited and Metropolitan Stock Exchange Limited. It is also registered as a Depository Participant with
CDSL and Portfolio Manager with SEBI. It also has registration with AMFI as a Mutual Fund Distributor. Angel Broking Private Limited is a
registered entity with SEBI for Research Analyst in terms of SEBI (Research Analyst) Regulations, 2014 vide registration number
INH000000164. Angel or its associates has not been debarred/ suspended by SEBI or any other regulatory authority for accessing
/dealing in securities Market. Angel or its associates/analyst has not received any compensation / managed or
co-managed public offering of securities of the company covered by Analyst during the past twelve months.
This document is solely for the personal information of the recipient, and must not be singularly used as the basis of any investment
decision. Nothing in this document should be construed as investment or financial advice. Each recipient of this document should make
such investigations as they deem necessary to arrive at an independent evaluation of an investment in the securities of the companies
referred to in this document (including the merits and risks involved), and should consult their own advisors to determine the merits and
risks of such an investment.
Reports based on technical and derivative analysis center on studying charts of a stock's price movement, outstanding positions and
trading volume, as opposed to focusing on a company's fundamentals and, as such, may not match with a report on a company's
fundamentals. Investors are advised to refer the Fundamental and Technical Research Reports available on our website to evaluate the
contrary view, if any.
The information in this document has been printed on the basis of publicly available information, internal data and other reliable
sources believed to be true, but we do not represent that it is accurate or complete and it should not be relied on as such, as this
document is for general guidance only. Angel Broking Pvt. Limited or any of its affiliates/ group companies shall not be in any way
responsible for any loss or damage that may arise to any person from any inadvertent error in the information contained in this report.
Angel Broking Pvt. Limited has not independently verified all the information contained within this document. Accordingly, we cannot
testify, nor make any representation or warranty, express or implied, to the accuracy, contents or data contained within this document.
While Angel Broking Pvt. Limited endeavors to update on a reasonable basis the information discussed in this material, there may be
regulatory, compliance, or other reasons that prevent us from doing so.
This document is being supplied to you solely for your information, and its contents, information or data may not be reproduced,
redistributed or passed on, directly or indirectly.
Neither Angel Broking Pvt. Limited, nor its directors, employees or affiliates shall be liable for any loss or damage that may arise from
or in connection with the use of this information.